
Thankyou to all my past subscribers your interest and comments are appreciated.
After a long break I am considering reopening the service which will cover the US Indices Crude and FX as well as a few other instruments. Here are some notes and observations on Crude which I wanted to send out to everyone . If you have any questions or comments you can email me at grantallen128@yahoo.com.au and I will try to respond to your queries.
Regards Grant
For Crude the two main dates to watch are the weekend of Mar 22-25th and Apr 4th so my strategy at present would be to wait for the first trigger date to roll in and a few days beforehand we should be in a clearer position to determine if we are either setting up into Top or a counter trend Low move. View these two dates as a section of movement that we are planning to trade so it is important to not pre-empt the market but just let the first date come in then we can can trade out of that date into the prevailing direction of the market. As can be seen in the notes below there are several historical sections that are examined. The current market made Low on Dec 13th 2023 and it is interesting to note that Dec 25th 2018 also saw Low before a large move higher into the later part of April which measured 119 Deg in time an advance of 57% off the base. The next section under review was 2021 with Low on Dec 2nd with trend up till Mar 7th 2022 a move of 95 Deg in time and an advance of 109% off the base. It appears that Dec is the Seasonal time period for Low in these two examples so these two swings will serve as an important comparison against the current move up.
The third section is 2018 which saw Low in the first week of Feb with the swing comprising of three sections . Of particular interest is the swing up till Mar 26th AB which ran out 45 Deg in time an advance of 14.7% off the base followed by a short correction into Apr 6th a decline of - 7.1% in 11 days followed by a third leg higher into Main Top. This section has a similar match in time to the current projection so it will be interesting to see if the market continues to move higher into the first trigger date. This AB move ran out in 45 Deg or 1/8 of a yearly Cycle and note the AC move culminating in final Top measures 102 Deg from the base an advance of 25.2% so we will keep these time periods in mind when reviewing the current structure. Main Low was made on Dec 13th 2023 which comprises of a three swing pattern similar to the 2018 structure in terms of time and price amplitude. Looking at the current swing we also have two pullbacks with current price above recent highs sitting at around 81.62 so my strategy would be to wait for the first trigger date to present itself and see if that time period and swing amplitude balances against any past moves. The current percentage gain off the Dec 2023 Low measures around 20.7% which is similar in magnitude to the 2018 swing at 25.2% which could serve as a potential gauge but the main consideration is to let the trigger date roll around and a few days before we can tighten up our price analysis linking it against past movements. An important thing to note is the time projection from Dec 13th 2023 Low to Mar 22-25th 2024 is 101 Deg which balances against the 2018 swing at 102 Deg into Top and is also fairly close in time to the 2021 swing at 95 Deg so if we do have an extended move up into the first target date it could be a clear confirmation we are setting up for Top. My position remains neutral until 22-25th Mar and at that time if we have clear direction that will be the catalyst for a position with a time based stop around that date. Also note the current swing sits at 20.7% off the base against the 2018 move which was 25% so that could also be a handy point of measurement as we lead into the Cycle date. Also outlined in the notes are the counter trend reactions so if we do start pulling back we can use these measurements as a gauge to calculate the amplitude of decline.
We have a Full Moon on the 22nd March culminating with the Cycle calculation which will be another important factor for trend reversal.
For price keep an eye on 83.75 - 84.00 which is opposite the Low and also 86.00 which is on the degree of the Time Angle but the first price should be more important to monitor.
Crude Oil update
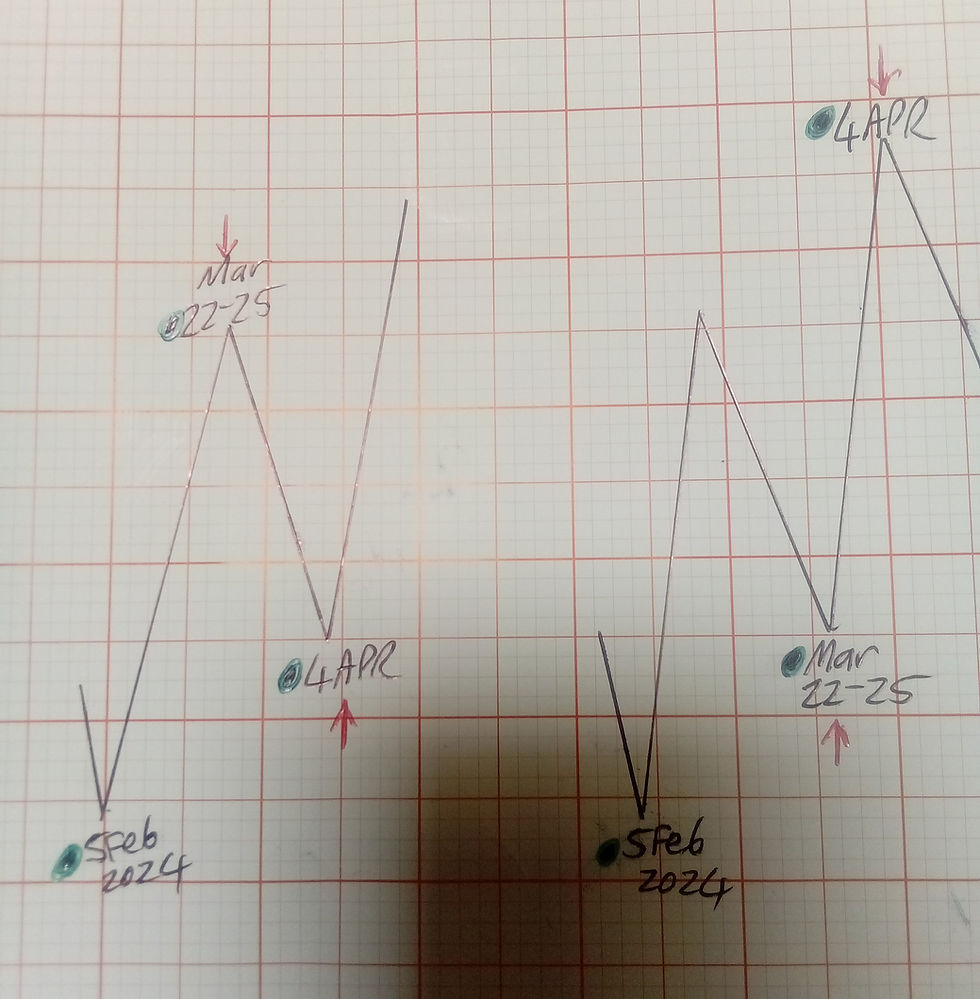
Last night Crude continued its move up so below I have presented two Curves based around my two timing dates. You can view this as trading a section of the market move so my strategy as outlined above is to wait a few more days and see how price moves into the weekend of 22-25th March and there are two outcomes displayed below. The first scenario is a continuation up into Top then a pullback into Apr 4th or a pullback into the 22-25th then a Top into Apr 4th so these two scenarios are presented ahead of time and the price action over the next few bars leading into this date should allow us to determine market position.
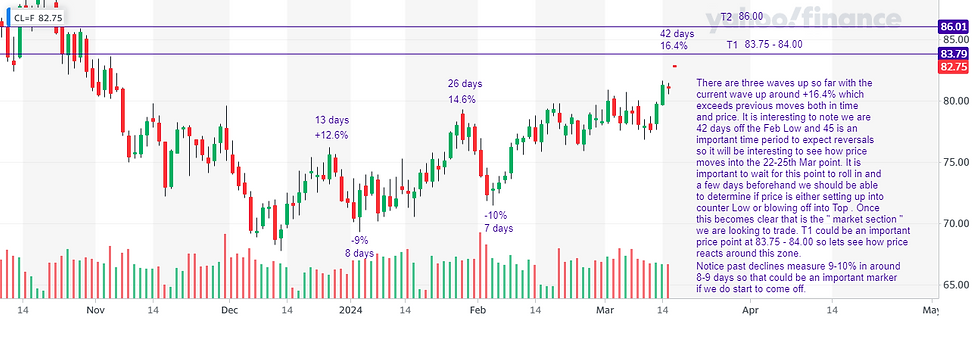
The main price level to watch is T1 around 83.75-84.00 and the secondary level is T2 around 86.00 but T1 is the stronger point to watch. It is also interesting to note that we are currently up around 42 days so the 45 day mark which culminates around the 22nd could be significant as reversals can often culminate around these counts. If we do get Top into one of those mentioned dates notice the last two pullbacks were approx 9% in 8-10 days so we could use these figures as a potential expectation on what may occur but please bear in mind they are only measures at this point and the main consideration at the moment is how price moves into the first target date and what Curve it is aligning against so it is important to not pre-empt the trend but to be patient and wait for confirmation. Around the first target date you could then scale down to an intraday 30 or 60 min chart and look for patterns and price to confirm the Cycle date . As an example if price does make Top on the 22-25th Mar we could study the 30 or 60 min chart to see if we are making lower Tops and if the intraday pattern is in sync with our projection this could be a strong indication but it is critical to wait for the Timing dates to approach and judge the position of the market against them.

Comments